About me

Data Analyst based in Baku, Azerbaijan. I work across the full data lifecycle — collecting, cleaning, exploring and modelling data with SQL, Python, Excel and Power BI — turning it into dashboards that answer real business questions.

How I Work

  • data collection icon

    1Data Collection

    Databases with SQL, the web with Python scrapers — automated to run itself.

  • data cleaning icon

    2Data Cleaning

    Missing values, duplicates and messy formats fixed in Python and Excel — so the numbers hold up.

  • exploratory analysis icon

    3Exploratory Data Analysis

    Patterns, outliers and relationships surfaced in Power BI dashboards you can read at a glance.

  • modelling icon

    4Modelling & Algorithms

    Statistical methods and algorithms that explain what drives the numbers — and predict what's next.
Resume

Education

  1. Yildiz Technical University

    BSc. Mathematical Engineering (2018 — 2022)

    A degree built on statistics, linear algebra, numerical methods and programming. It's where I learned to turn a vague problem into a model, and a model into an answer someone can act on.

Experience

  1. Business Analyst (Intern)

    Bir Ecosystem — Baku, Azerbaijan (08/2026 — Present)

    Collecting and analysing data to surface customer needs, business trends and KPIs, and supporting the reports and presentations that go to senior management. Also involved in requirements gathering, process mapping and workflow analysis for new projects.

  2. Teaching Assistant (Intern)

    Israel Azerbaijan Training Center (02/2023 — 05/2023)

    Supported the instructor on a data analytics course: walked students through Python, SQL and statistics in the lab, reviewed their analyses, and broke down the concepts they got stuck on.

  3. Data Analyst (Intern)

    International Training & Project Center (09/2021 — 03/2022)

    Cleaned and analysed large datasets using statistical techniques, identified trends to generate actionable insights, and designed reports and visualisations for stakeholders.

Certifications & Awards

  1. Data Analyst Professional Certificate

    IBM (07/2026)

    Show credential
  2. Data Analytics

    Handex (07/2026)

    Show credential
  3. Data Science with Python

    Data SoCool (05/2024)

    Show credential
  4. Programming Essentials in Python (PCAP)

    Cisco Networking Academy · OpenEDG Python Institute (03/2023)

    Show credential
  5. Investigation of Brain Tumor Segmentation Using U-Net Architecture

    TÜBİTAK · 2209-A Research Projects Programme (11/2022 — 11/2024)

    Show credential

Skills

  • Python pandas, requests, BeautifulSoup
  • SQL joins, aggregation, window functions
  • Power BI DAX, data modelling, dashboards
  • Excel pivot tables, lookups, reporting
  • Web Scraping automated collection pipelines
  • Git version control

Languages

  • Azerbaijani Native
  • Turkish C1
  • English B2
Download full CV (PDF)

Portfolio

Projects I've built — data collection, analysis and dashboards.

  • HR Workforce Analytics — Oracle SQL and Python

    HR Workforce Analytics

    Oracle SQL & Python — End to End

    • Oracle 18c
    • SQL
    • Python
    • Data Engineering

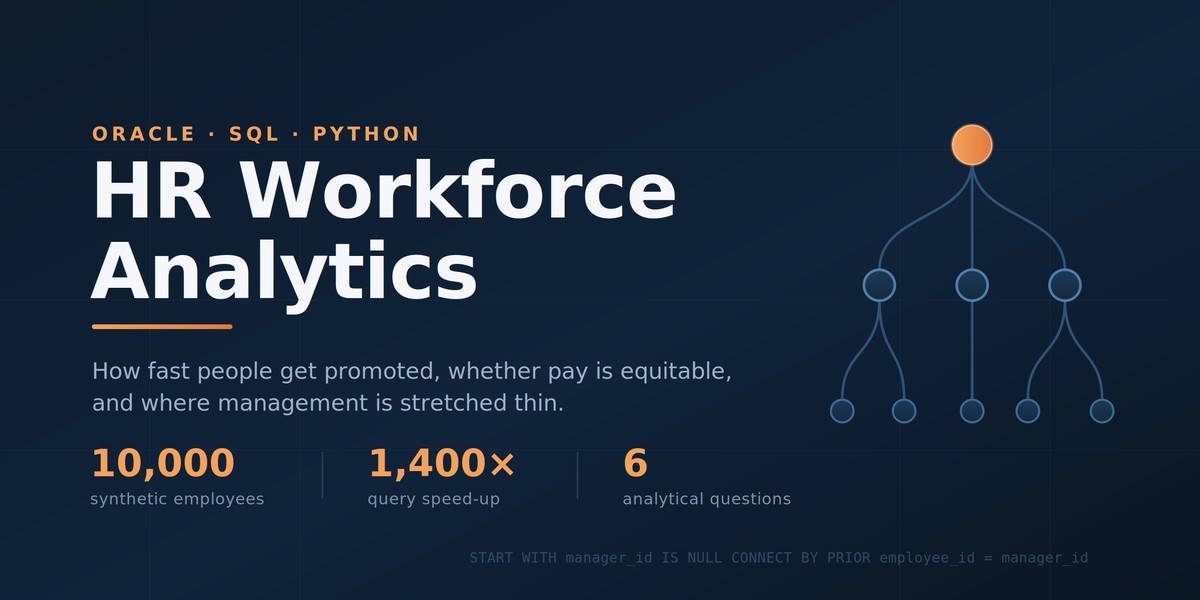
    A synthetic 10,000-employee organisation built in Oracle, then analysed end to end. The heavy computation — window functions, hierarchical CONNECT BY queries, percentiles — runs in the database; Python handles interpretation. Every query lives in sql/ as a reviewable file, not a string in a notebook.

    What the analysis showed

    • Promotions are driven by opportunity, not just performance — one department promotes 14.5% of staff simply because it has 6.6 juniors per senior seat.
    • A fixed 24-month observation window flips which hiring cohorts look "under-promoted" — the framing changes the finding.
    • Rewrote one hierarchy query from a correlated subquery to a pre-aggregated CTE: 85.6s → 0.06s, ~1,400× faster, same result.
  • Crimes in Boston — exploratory analysis and severity prediction

    Crimes in Boston

    EDA & Severity Prediction

    • Python
    • pandas
    • scikit-learn
    • Folium

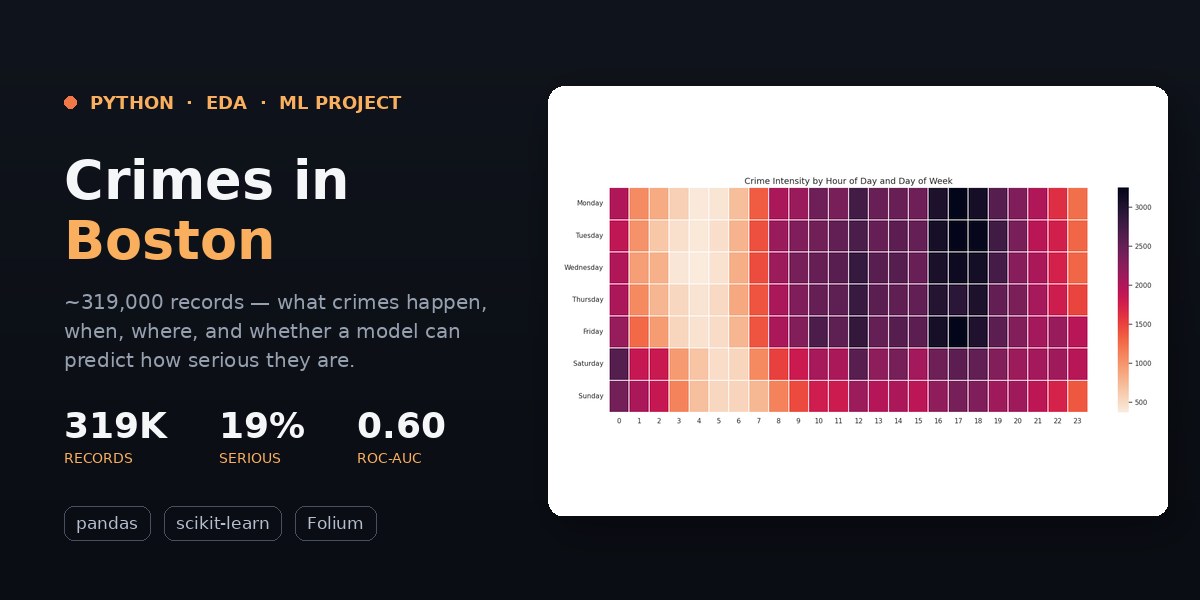
    An end-to-end look at ~319,000 Boston crime records (2015–2018): what happens, when, and where — then a Random Forest testing whether time and place alone can predict how serious an incident is. The hard part wasn't the model; it was Latin-1 encoding, partial years and invalid coordinates.

    What the data showed

    • Most "crime" isn't violent — top calls are vehicle response, medical aid and investigations. Serious offenses are only ~19% of the data.
    • Crime has a rhythm: it peaks on summer evenings (4–6pm) and stays active through weekend nights.
    • Violence concentrates — shootings are 0.32% of incidents, but 74% hit just 3 districts, overwhelmingly late at night.
    • Using only time and place (no offense type, to avoid leakage), the model reached ROC-AUC 0.60 — a modest but real signal.
  • Credit Card Churn Analysis — Power BI dashboard

    Credit Card Churn

    Interactive Power BI Dashboard

    • Power BI
    • Power Query
    • DAX
    • Slicers

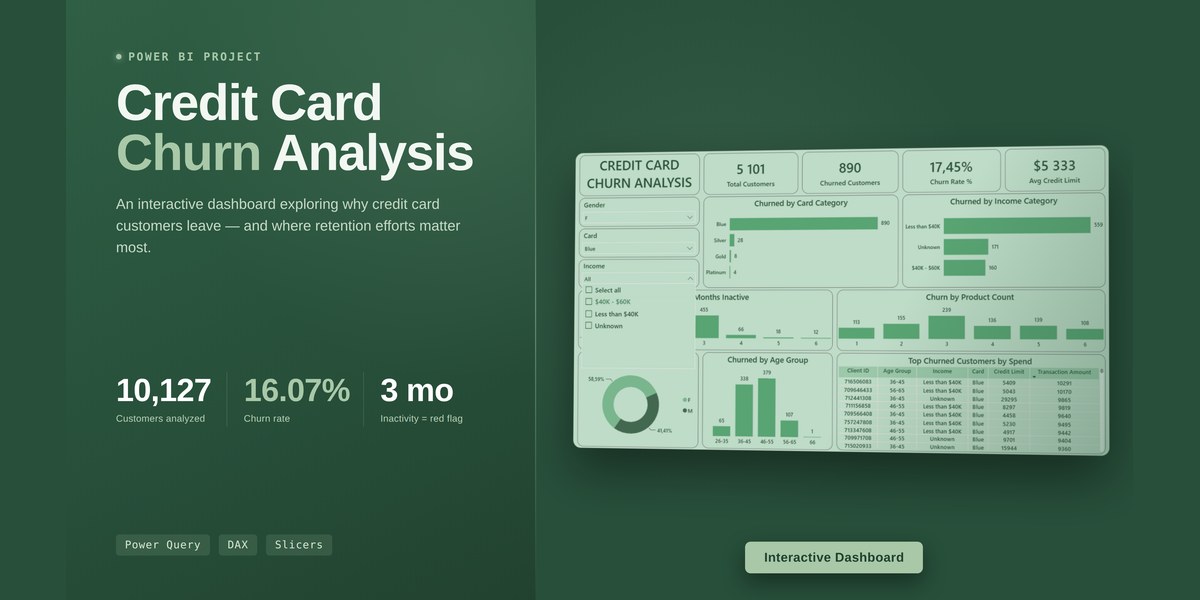
    A dashboard exploring why credit card customers leave — and where retention effort pays off. Power Query for cleaning, DAX for the measures, and slicers that filter the whole report by gender, card, and income. 10,127 customers analysed.

    What the data showed

    • Overall churn is 16.07% — but customers inactive for 3 months churn the most, an early-warning signal worth acting on.
    • Low-income customers (under $40K) churn hardest, and churn drops sharply as people hold more products — cross-selling is a retention lever.
    • The 46–55 age group carries the highest churn count.
  • Oxu.az News Dataset — 52,946 Azerbaijani news articles

    Oxu.az

    News Dataset — 52,946 articles

    • Python
    • Web scraping
    • EDA
    • Kaggle

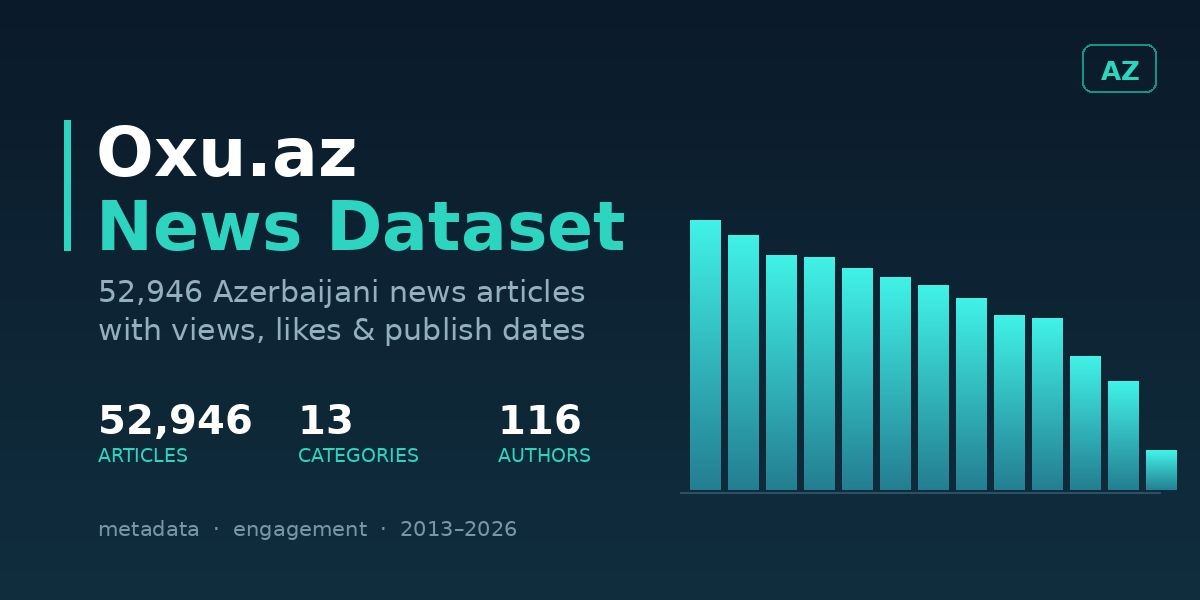
    Local-language datasets are scarce, so I built one. A Python pipeline walks the archives of 13 categories and collects the title, date, author and reader reactions for every article published since 2013 — 52,946 articles in total.

    What the analysis showed

    • Sports is the most written-about category (5,812 articles), but Society is the most read — editorial focus and audience interest don't line up.
    • In culture, tourism, ICT and show business the median article gets zero likes. Sports and politics run about three likes per dislike. People read the quiet categories; they just don't press the button.
    • Short titles (1–4 words) hold a slight engagement edge — smaller than the folklore suggests.
  • Global Superstore interactive Excel dashboard

    Global Superstore

    Interactive Excel Dashboard

    • Excel
    • Power Query
    • Power Pivot
    • DAX

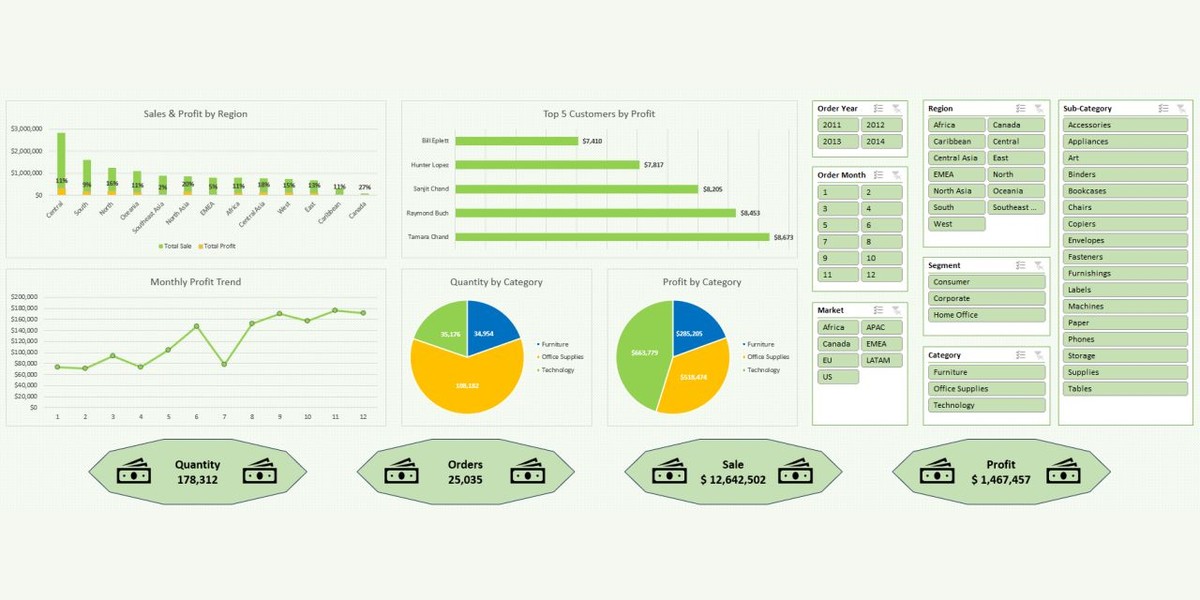
    A fully interactive dashboard on the Global Superstore dataset: Power Query for cleaning and transformation, Power Pivot and DAX for the model and measures, PivotCharts and slicers for the front end.

    What the data showed

    • Central leads on sales at $2.8M; North Asia has the best margin at 20%.
    • Technology drives profit even though Office Supplies moves more units — volume and profit are not the same story.
    • Southeast Asia sits at a 2% margin. That's the number worth a meeting.

Contact

Every dataset has a story. Tell me yours.

Contact Form